
Butterflies are shifting worldwide, but the losses are going unseen
Synthesis of 1,758 species in 105 countries finds climate the most cited driver, but English-language and European monitoring skews the record toward expansions while tropical contractions and upslope moves go undercounted.


What happenedA global synthesis of 6,182 records for 1,758 butterfly species in 105 countries between 1991 and 2022 documented range expansions in 80% of species, contractions in 27% and elevational shifts in 22%.
Why it mattersButterflies are sensitive pollinators and early sentinels, so their reshuffling signals wider ecosystem reorganization and that protected areas drawn on fixed maps will miss species on the move.
Still openWhether expansions truly dominate or are simply reported more often, and how far climate outweighs habitat loss and fragmentation, remains unclear without standardized monitoring in tropical and mountain regions.
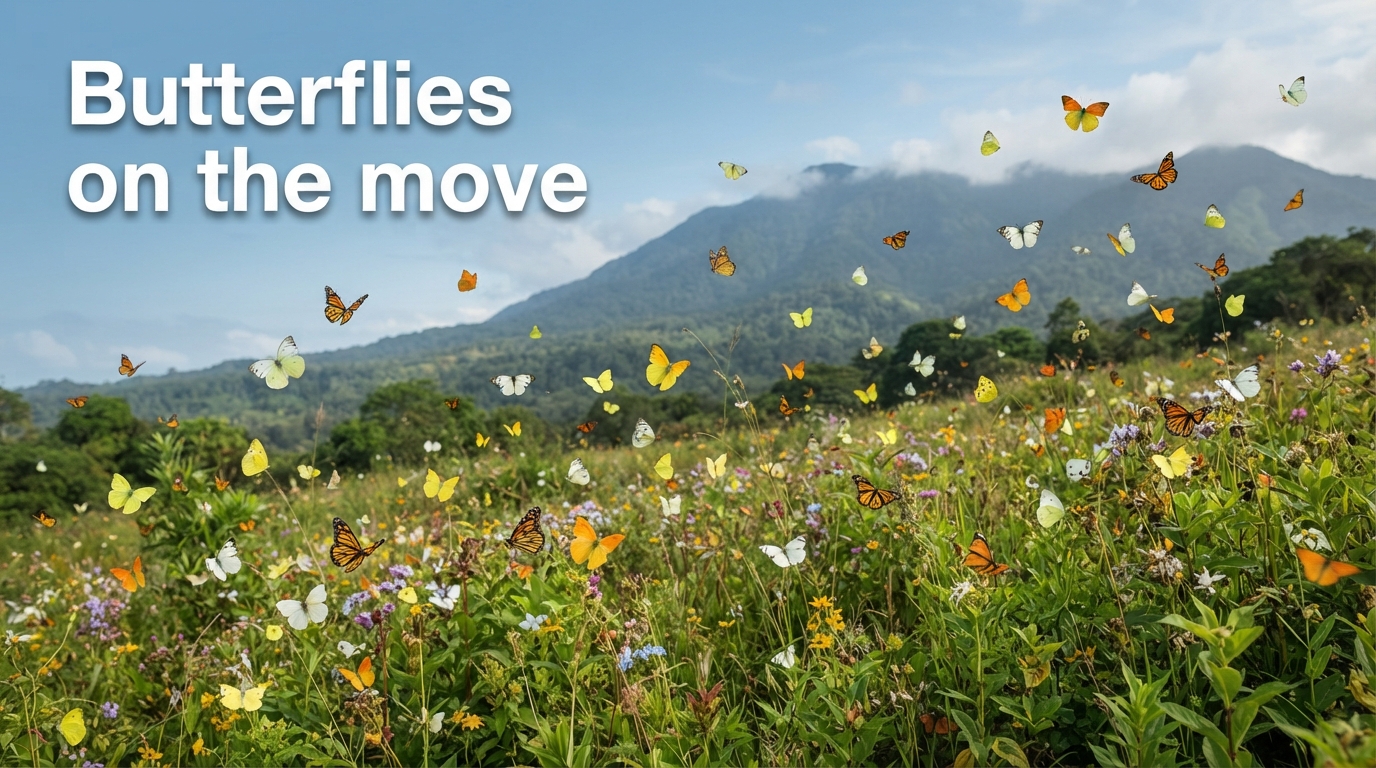
On 5 August 2026 in Nature Ecology & Evolution, the largest global synthesis of butterfly range shifts compiled 6,182 records for 1,758 species — about one in ten of the roughly 19,327 known butterflies — across 105 countries and found 80% had expanded their ranges, 27% had contracted and 22% had shifted elevation, most often linked to climate change. That reshuffling matters because butterflies are early-warning sentinels for wider ecosystem reorganization — from pollination to where nature reserves actually protect anything — but whether the dominance of expansions and the apparent rarity of tropical losses reflects real ecology or simply where we monitor remains unresolved.
The work was led by Shawan Chowdhury, head of the Global Change Ecology Lab at Monash University in Australia, with senior authors at the German Centre for Integrative Biodiversity Research (iDiv), the Helmholtz Centre for Environmental Research (UFZ) and the Friedrich Schiller University Jena, and co-authors from more than 49 countries. It drew on 567 studies and 68 expert assessments in 15 languages between 1991 and 2022, deliberately to correct an English-language bias that has left nearly half of prior redistribution literature coming from Europe.
What the 80% actually counts
This is not a speedometer. The study records whether a species was documented expanding, contracting or moving upslope or downslope — presence or absence of a shift type — not how fast range edges moved in kilometres per decade or metres per decade.
That breadth is the strength, and the limit. With 6,182 records covering six butterfly families across every continent where butterflies occur, it is the most geographically inclusive picture yet. But 65% of species have only a single record from a single study and country, and only 94 species — 5% — have more than ten independent records. The authors call the result explicitly semi-quantitative and warn against reading the percentages as absolute global rates or as velocities. For context, an earlier cross-taxa meta-analysis estimated median shifts of about 16.9 km per decade poleward and 11.0 m per decade upslope, but that benchmark comes from outside this dataset, which could not compile comparable rates and uncertainties.
In other words, the synthesis tells us how widely different kinds of moves have been documented, not how far or how fast butterflies as a whole are moving.
Expansions everywhere, contractions and upslope moves where we look
The headline hides an asymmetry.
Horizontal expansions were documented on every continent, including in tropical countries such as Brazil and Benin — contradicting a recent synthesis that claimed little evidence for tropical expansions. Contractions were concentrated in temperate Europe and North America, where long-term monitoring exists — for example Belgium, the United Kingdom and Sweden. Elevational shifts were found across tropical, temperate and boreal regions but almost exclusively in the Northern Hemisphere, despite theory predicting faster upslope moves in the tropics where temperature drops more steeply with elevation.
That pattern tracks effort, not just ecology. In five European nations — the Czech Republic, Finland, Luxembourg, Spain and Sweden — range-shift records exist for at least half of the national butterfly fauna. In most other countries, fewer than 10% of species have any documented shift. Large tropical regions remain markedly under-represented: Central Africa, Southeast Asia, the Amazon Basin and New Guinea.
The language of the source matters too. English-language studies over-represented expansions and under-represented contractions, while expert assessments showed the opposite. When counted by unique source per shift type, English sources had a standardized residual of 2.94 for expansions and -4.14 for contractions; experts had 5.73 for contractions and -4.68 for expansions, a difference unlikely by chance (Pearson's chi-squared 38.14, P<0.001). Non-English studies sat near zero. Relying on English literature alone would make the world look like it is mostly expanding; adding experts and multilingual sources reveals more contractions.
Country percentages that circulate — the Czech Republic with 84% of its documented-shift species showing expansions, Sweden with 85% showing contractions, Mexico with 39% showing elevational shifts — are documentation coverage within the database, not the share of all butterflies in that country that are shifting.
Climate most reported, but frequency is not magnitude
Across 352 species with threat data, climate change and severe weather was the most frequently reported driver — 79% of shifts (278 species), especially for expansions (163 species) and elevational shifts (61 species). For contractions, agriculture and aquaculture and human intrusions and disturbance were most frequent (143 species).
Regionally, climate dominated most continents, but not everywhere: in Oceania, residential and commercial development and invasive species were most reported; in South America, human disturbance led.
Those are reporting frequencies from heterogeneous literature and expert elicitation, not measured effect sizes. Most primary studies did not estimate multi-driver effect sizes, and climate variables are often more readily available than fine-scale habitat degradation, which can inflate climate's apparent dominance. An effort-adjusted sensitivity analysis left the ranking qualitatively similar, but the caveat remains: how often a driver is named is not how strongly it drives.
Quantitative studies that do compare drivers point the other way on magnitude. Across 291 British invertebrate species, habitat availability at range margins explained substantially more variation in poleward shift rates than climate exposure alone — about 13% of variation versus 4% — and up to 44% when habitat, climate and their interaction were combined for well-recorded groups. In Sweden and Finland from 1901 to 2019, colonisation rates varied with forest cover, grassland and human settlements even after accounting for temperature change, and peaked at intermediate warming of around 0.30°C per decade, with diminishing returns at faster warming — consistent with time lags.
Expansions on every continent, contractions and upslope moves mostly where monitoring is densest. Share of documented butterfly range-shift types by region (Chowdhury et al., 2026, Extended Data Fig. 2): horizontal expansions dominate in the tropics (~81% of regional observations; n=684) and in non-European non-tropical countries (~65%; n=702), while Europe is nearly balanced among expansions (41%, n=242), contractions (37%, n=219), and elevational shifts (21%, n=124)—where monitoring is densest. Main takeaway: the global ~80% expansion headline is not uniform geography; contractions and elevational moves concentrate in better-sampled temperate settings, and elevational shifts are almost exclusively Northern Hemisphere. Limit: semi-quantitative presence/absence of shift type (not km/decade rates); 65% of species have a single record; percentages are of the 1,758-species evidence base, not all ~19,327 butterflies. Species counts digitized from Extended Data Fig. 2. English-language sources over-represent expansions (std. residual +2.94) versus expert assessments (contraction residual +5.73). Publisher: Nature Ecology & Evolution — AI-assisted analytic, built only from real cited or sourced data. Source: Nature Ecology & Evolution, StudyFinds, EurekAlert! / Monash University. As of 2026-08-09.
The result is a lag the authors call climatic debt: the gap between where climate has moved and where species have actually moved. At continental scale, butterfly communities shifted about 114 km north between 1990 and 2008 while temperature isotherms — lines connecting places with the same average temperature — shifted faster, leaving a 135 km lag; in northern Europe, expansions averaged roughly 1-3 km per year while isotherms (lines of equal temperature) moved about 3 km per year on average and up to 8 km per year in recent periods, with little correlation between the two (r=0.16, P=0.077). Even where climate becomes suitable, colonization can fail if host plants, microclimates or habitat connectivity are missing.
Who is most exposed where we look least
Tropical and mountain species face the greatest risk, and are the least monitored.
Tropical butterflies often live near their upper thermal limits — the hottest temperatures they can tolerate — with narrow tolerance, restricted ranges and isolation from cool refugia. Even small warming can exceed those limits, especially where fragmentation blocks movement. About two-thirds of butterfly species are primarily mountain-dwelling, with richness and endemism concentrated above 2,000 metres, yet mountain climates are eroding quickly.
A cited global analysis integrating 12,119 butterfly species projects up to 64% erosion of temperature niche space by 2070-2100 under a high-emissions scenario known as Representative Concentration Pathway 8.5 (RCP 8.5, 2061-2080), even assuming species can fully disperse within their biogeographical realms, with rare tropical high-elevation species most exposed. That is a scenario, not an observed outcome in this dataset, and it depends on dispersal assumptions — but it signals why blind spots matter. Low-coverage families such as Riodinidae and regions with no data are places where losses could go undetected, and where elevational shifts are most under-documented.
Why 80% expanding does not mean butterflies are thriving
The expansions are filtered.
They are biased toward ecological generalists — species that produce multiple generations per year, tolerate a broad range of temperatures, have large ranges and often associate with forests — that can advance their seasonal timing and increase abundance. In a century-long northern Europe analysis, establishment success rose with larger European range size and broader thermal niche.
Specialists lose in the same warming. Among univoltine species — those with one generation per year — habitat specialists declined in abundance when they emerged earlier in the season, while generalists did not. Traits alone, however, appeared weak predictors when taken in isolation in one analysis of 291 British invertebrate species cited in the synthesis: habitat specialization explained only about 4% of variation in shift rates, compared with about 13% for habitat availability at the margin, suggesting whether a trait helps may depend on whether the required habitat is actually present at the range edge.
Combined with reporting bias toward expansions in English literature, and with 23% of species showing multiple shift types — for example, the black-veined white Aporia crataegi expanding and contracting in Andorra, and four species showing both upslope and downslope moves — the picture is not uniform poleward and upslope success. It is community reshuffling and biotic homogenization: northern communities becoming richer in species but more similar, dominated by mobile generalists, while specialists are left behind. Expansions can co-occur with local extirpations driven by habitat degradation, even where no national extinctions were recorded in the century-long data.
Sentinels, not just wings
Butterflies are used as bioindicators because they are sensitive to temperature, depend on specific host plants, have short generations and can disperse relatively well. When their ranges shift this dramatically, it signals broader reorganization.
As pollinators alongside bees, flies and beetles, butterflies are part of plant-pollinator networks. The synthesis does not quantify pollination impacts, but the literature it draws on warns of cascading mechanisms: reshuffled communities, disrupted coevolved interactions, mismatches where flowering times and butterfly emergence diverge, and reduced host-plant availability if plants cannot track climate as fast. Generalist pollinators may switch plants and increase competition; specialist interactions are more fragile. Landscape heterogeneity, microrefugia — small shaded or forested patches where species shelter on hot days — and connectivity can buffer some of this, but they are not measured as outcomes here.
Fixed reserves for moving species
Protected areas — the network of parks and reserves — and the Kunming-Montreal Global Biodiversity Framework, the international plan for protecting biodiversity, were largely designed around fixed maps of where species live now.
That design is mismatched to multidirectional moves. Cited assessments find 76% of insect species and 85% of migratory butterflies inadequately represented in the current protected-area network, and the International Union for Conservation of Nature (IUCN) Red List, the global inventory of species' extinction risk, still relies on static range maps. Species that both expand horizontally and adjust elevation need connectivity — what conservation frameworks call resist-accept-direct actions to maintain corridors — while contracting species need habitat protection and restoration.
The authors propose three linked responses: expand monitoring in under-represented tropical, arid and mountain regions, including digitizing museum collections and using local-language literature; integrate citizen science — platforms like iNaturalist and even social media records, as shown for the tawny coster Acraea terpsicore — calibrated with structured transect walks and timed counts; and incorporate real-time range dynamics into spatial planning under the Kunming-Montreal framework, including scenario-based forecasting for data-poor species.
Without that, conservation will continue to be guided by a biased evidence base. The synthesis itself shows how much the picture changes when 15 languages and 68 experts are included. The next step is not just more records, but standardized, comparable rates — kilometres per decade poleward and metres per decade upslope — that can be tested against how fast climate itself is moving, and that can tell us whether tropical contractions and upslope shifts are truly rarer or simply unseen.
Source recordSources / claims / limits
How this piece is framed: Worldwide redistribution already underway, filtered by where we look — climate-linked expansions documented on every continent, but contractions and upslope moves hidden by monitoring gaps where vulnerability is greatest, producing a trait-filtered reshuffling that static conservation cannot hold
Charts & tables — AI-assisted; provenance on each line
- What kind of move was documented depends on where we looked — sourced for this figure · as of 2026-08-09
Visuals not shipped — planned but not fulfilled
- Global coverage of butterfly range-shift records, 1991-2022 (req_map_coverage_gaps): failed — worker produced nothing (grok timed out after 600.0s)
Sources
- (primary) Extensive climate-induced range shifts in butterflies across the globe — Nature Ecology & Evolution — https://www.nature.com/articles/s41559-026-03117-y · read in full · captured 2026-08-09
- (primary) Habitat availability explains variation in climate-driven range shifts across multiple taxonomic groups — Scientific Reports — https://www.nature.com/articles/s41598-019-51582-2 · read in full · captured 2026-08-09
- (primary) Rapid range shifts of species associated with high levels of climate warming — Science — https://www.science.org/doi/10.1126/science.1206432 · read in full · captured 2026-08-09
- (primary) Differences in the climatic debts of birds and butterflies at a continental scale — Nature Climate Change — https://www.nature.com/articles/nclimate1347 · read in full · captured 2026-08-09
- (primary) Climate-induced phenology shifts linked to range expansions in species with multiple reproductive cycles per year — Nature Communications — https://www.nature.com/articles/s41467-019-12479-w · read in full · captured 2026-08-09
- (primary) Global hotspots of butterfly diversity are threatened in a warming world — Nature Ecology & Evolution — https://www.nature.com/articles/s41559-025-02664-0 · read in full · captured 2026-08-09
- (primary) Century-long butterfly range expansions in northern Europe depend on climate, land use and species traits — Communications Biology — https://www.nature.com/articles/s42003-023-04967-z · read in full · captured 2026-08-09
- (secondary) 4 Out Of 5 Butterfly Species Moving Into New Territory As Earth Heats Up — StudyFinds — https://studyfinds.com/butterfly-moving-territory-earth-heats-up · read in full · captured 2026-08-09
- (secondary) Butterflies worldwide are on the move as the climate warms — EurekAlert! / Monash University — https://www.eurekalert.org/news-releases/1138655 · full text not obtained — used its summary
- (secondary) Butterflies on the move worldwide due to climate change — University of Western Australia — https://www.uwa.edu.au/news/article/2026/august/butterflies-on-the-move-worldwide-due-to-climate-change · full text not obtained — used its summary
- (secondary) Insects as bioindicator: A hidden gem for environmental monitoring — Frontiers in Environmental Science — https://www.frontiersin.org/journals/environmental-science/articles/10.3389/fenvs.2023.1146052/full · full text not obtained — used its summary
- (secondary) Butterfly ranges shift worldwide amid climate change, with most species expanding their reach — Phys.org / German Centre for Integrative Biodiversity Research (iDiv) — https://phys.org/news/2026-08-butterfly-ranges-shift-worldwide-climate.html · full text not obtained — used its summary
Claims, and how far we tracked each down
- [confirmed] Global study published 5 August 2026 in Nature Ecology & Evolution titled 'Extensive climate-induced range shifts in butterflies across the globe' with DOI 10.1038/s41559-026-03117-y · read in full (as of 2026-08-09)
- [confirmed] Study led by Dr Shawan Chowdhury (Global Change Ecology Lab, School of Biological Sciences, Monash University, Australia) with senior authors Guy Pe'er (iDiv / UFZ / University of Jena) and Jonathan Lenoir, involving co-authors from more than 49 countries · read in full (as of 2026-08-09)
- [confirmed] Dataset comprises 6,182 range-shift records from 567 unique studies plus 68 expert assessments, covering 1,758 butterfly species across 105 countries and territories on every continent where butterflies occur · read in full (as of 2026-08-09)
- [confirmed] 1,758 species represents ~10% of known global butterfly diversity (19,327 species across six families: Nymphalidae 6,387, Lycaenidae 5,364, Hesperiidae 4,290, Riodinidae 1,571, Pieridae 1,165, Papilionidae ~550) · read in full (as of 2026-08-09)
- [confirmed] 80% of species in dataset (1,427 species from 97 countries) showed horizontal range expansions · read in full (as of 2026-08-09)
- [confirmed] 27% of species (480 species from 27 countries) showed horizontal range contractions and 22% (381 species from 18 countries) showed elevational range shifts; categories overlap because 23% of species (409 species) showed multiple types · read in full (as of 2026-08-09)
- [confirmed] 79% of all recorded range shifts (278 of 352 species with threat data) were associated with climate change and severe weather as the most frequently reported driver · read in full (as of 2026-08-09)
- [confirmed] Study did not provide standardized poleward (km per decade) or upslope (m per decade) rates; it is a semi-quantitative synthesis of documented presence/absence of shift types, and authors note they could not compile comparable quantitative rates and uncertainties · read in full (as of 2026-08-09)
- [confirmed] Horizontal expansions were documented on every continent, with high numbers in tropical countries (e.g., Brazil, Benin); contractions were concentrated in temperate Europe and North America (e.g., Belgium, UK, Sweden); elevational shifts were almost exclusively in the Northern Hemisphere and rarely documented in the tropics · read in full (as of 2026-08-09)
- [confirmed] Geographic asymmetry documented in primary text: horizontal expansions on every continent including tropics (e.g., Brazil, Benin) contradicting prior synthesis claiming little tropical expansion; contractions concentrated in temperate Europe/North America (Belgium, UK, Sweden); elevational shifts almost exclusively Northern Hemisphere despite steeper tropical lapse rates theoretically favoring faster upslope shifts. Country coverage percentages quantify documentation in evidence database, not absolute prevalence. · read in full (as of 2026-08-09)
- [confirmed] Country-level documentation coverage: Czech Republic 84% for expansions, Sweden 85% for contractions, Mexico 39% for elevational shifts (percentages relative to species with at least one shift record anywhere); five European nations (Czech Republic, Finland, Luxembourg, Spain, Sweden) have shift records for >50% of national butterfly fauna · read in full (as of 2026-08-09)
- [confirmed] Tropical species are especially vulnerable because they live near upper thermal limits, have restricted ranges, narrow thermal flexibility, and are isolated from cool refugia; two-thirds of butterfly species are primarily mountain-dwelling · read in full (as of 2026-08-09)
- [confirmed] Cited global analysis (Pinkert et al. 2025, ns2) integrating 12,119 butterfly species finds two-thirds are primarily mountain-dwelling, hotspots concentrated above 2,000 m, and projects up to 64% erosion of temperature niche space by 2070 (RCP 8.5, 2061 80 ensemble) even assuming full dispersal within biogeographical realms, with rare tropical high-elevation species most exposed; ns1 cites this as ref 46 for future contraction risk. · read in full (as of 2026-08-09)
- [confirmed] Standardized rate benchmark absent from ns1: Chen et al. 2011 meta-analysis of range shifts across taxa estimates median shifts of 16.9 km per decade poleward (latitudinal) and 11.0 m per decade upslope (elevational), ~23 faster than previously reported, with rates greatest where warming is highest and high interspecific variation. This provides the quantitative km/decade and m/decade context that ns1 explicitly states it could not compile, anchoring interpretation of its semi-quantitative percentages. · read in full (as of 2026-08-09)
- [confirmed] Threat attributions are reporting frequencies, not effect sizes: climate change and severe weather most frequently reported (278/352 species with threat data; 163 expansions, 131 contractions, 61 elevational), while agriculture/aquaculture and human intrusions/disturbance dominate contractions (143 species); authors note climate covariates are more readily available than fine-scale habitat degradation, potentially inflating climate dominance, but effort-adjusted sensitivity analysis yields qualitatively similar rankings. · read in full (as of 2026-08-09)
- [confirmed] The 79% figure (278/352 species, clm_5e0c2c8248) is a reporting frequency of attributed drivers in heterogeneous literature/expert elicitation, not a quantified causal effect size or variance-explained estimate; most primary studies did not estimate multi-driver effect sizes and climate covariates are more readily available than fine-scale habitat degradation, potentially inflating climate's apparent dominance. Authors explicitly warn these are prevalence of reported attributions rather than magnitude of impact. · read in full (as of 2026-08-09)
- [confirmed] Across 291 British invertebrate species, habitat availability at range margins explains substantially more variation in poleward range-shift rates than climate exposure alone (habitat availability R2m=13%, R2c=21%; climate exposure R2m=4%, R2c=4%; for best-recorded groups habitat R2m=22% vs climate R2m=16%). Model including habitat + climate + interaction explains up to 44% (R2m) for well-recorded groups and extrapolates to >50% with universal recording coverage, indicating climate forcing is strongly masked by habitat constraints. · read in full (as of 2026-08-09)
- [confirmed] Land-use and landscape context constrain butterfly tracking of climate: in Sweden/Finland 1901-2019, provincial colonisation rate associations with forest cover, grassland cover and human settlements varied among periods (forest cover period P=0.010; urbanisation negative trend P=0.081) even after accounting for temperature change; colonisation peaked at intermediate warming (~0.30C/decade) with diminishing returns at faster warming, consistent with time-lags/climatic debt. Host-plant availability, habitat fragmentation and limited dispersal across islands/mountaintops are cited as direct restrictions on range shifts even where climate becomes suitable. · read in full (as of 2026-08-09)
- [confirmed] Butterflies accumulate significant climatic debt lag between realized distribution and shifting climatic suitability. At continental scale, butterfly communities shifted 114 km north 1990-2008 but temperature isotherms shifted faster, leaving a 135 km lag (birds 212 km lag); in northern Europe butterfly expansions averaged ~1-3 km/yr while isotherms moved ~3 km/yr on average and up to 8 km/yr in recent periods, with weak or non-significant correlation between expansion rate and temperature velocity (1901-2019 r=0.16, P=0.077). This demonstrates many species fail to track climate despite expansions elsewhere. · read in full (as of 2026-08-09)
- [confirmed] Expansions are trait-filtered, not uniform success: establishment success increased with larger European range size (P<0.001), broader thermal niche mean and range (both P<0.001, slope ~0.73-0.74), and forest habitat association; multivoltine species that advanced phenology increased abundance and expanded range margins, whereas univoltine species showed no benefit. This supports generalist, broad-niche, high-dispersal winners driving the 80% expansion signal. · read in full (as of 2026-08-09)
- [confirmed] Specialist and univoltine habitat specialists are losers in the same warming: phenology advances led to abundance declines among univoltine habitat specialists (n=21 specialists vs 109 generalists) but not among univoltine generalists; univoltine species overall showed neutral or negative abundance trends with earlier emergence, including reduced abundance in year t+1. This indicates net biodiversity outcome is reshuffling toward generalist, multivoltine communities, not just loss. · read in full (as of 2026-08-09)
- [likely] Species traits are weak overall predictors of range shifts when considered alone. Meta-analyses cited show no combination of intrinsic traits explains a large proportion of variation across taxa; habitat specialization is the most consistent predictor but explains only R2m=4% (R2c=6%) vs habitat availability R2m=13%, because trait effects depend on extrinsic landscape context (whether required habitat is common/rare at the margin). This limits deterministic prediction of which species will track climate. · read in full (as of 2026-08-09)
- [confirmed] 65% of species had only a single range-shift record from a single study and country; only 94 species (5%) had >10 independent records, limiting inference about rates and causality · read in full (as of 2026-08-09)
- [confirmed] Literature search covered 1991 22, used Web of Science (5,498 studies) and Google Scholar (7 keywords 200 hits) plus language-specific systems in 15 languages (Supplementary Information Section 1, Extended Data Fig. 5) and 68 expert assessments from 49 countries; English-language sources over-represented expansions (standardized residual 2.94) and under-represented contractions (4.14), expert assessments showed opposite pattern (contraction 5.73, expansion 4.68), Pearson c7=38.14, P<0.001. · read in full (as of 2026-08-09)
- [confirmed] Dataset comprises 6,182 range-shift reports from 567 unique studies plus 68 expert assessments, covering 1,758 butterfly species (~10% of 19,327 known species across six families) across 105 countries/territories on every continent where butterflies occur; 1,427 species expansions (80%), 480 contractions (27%), 381 elevational shifts (22%), with 409 species (23%) showing multiple types. · read in full (as of 2026-08-09)
- [confirmed] Study is explicitly semi-quantitative: it documents presence/absence of shift types and does not compile comparable standardized poleward (km/decade) or upslope (m/decade) rates with uncertainties; authors state future work could conduct a targeted meta-analysis of standardized rates which they were not able to compile here; 65% of species have a single record and only 94 species (5%) have >10 records, limiting rate inference. · read in full (as of 2026-08-09)
- [confirmed] English-language sources over-represented expansions and under-represented contractions; expert assessments showed opposite pattern, indicating reliance on English literature alone biases global summaries toward expansions · read in full (as of 2026-08-09)
- [confirmed] Butterflies are sensitive bioindicators due to high sensitivity to temperature, host-plant associations, short lifecycles and dispersal capacity, and serve as early-warning sentinels for climate impacts · read in full (as of 2026-08-09)
- [confirmed] Current protected-area network inadequately covers shifting species: 85% of migratory butterfly species and 76% of insect species are inadequately represented, and most protected areas were designed around fixed boundaries · read in full (as of 2026-08-09)
- [likely] The 80% expansion prevalence (clm_761db54ee1) may partly reflect detection/reporting bias rather than ecological success: English-language sources significantly over-represented expansions (standardized residual 2.94) and under-represented contractions (-4.14), while expert assessments showed opposite pattern; 65% of species have single record, and century-long northern Europe data show no national extinctions but documented local extirpations due to habitat degradation, suggesting expansions can co-occur with declines and that apparent dominance of expansions is sensitive to evidence source. · read in full (as of 2026-08-09)
- [likely] Recent global analysis cited projects up to 64% loss of temperature niche space for butterflies by 2100 (or 2070 in related study) even assuming full dispersal within biogeographical realms, implying major future contractions and particular risk for rare tropical high-elevation species · read in full (as of 2026-08-09)
- [confirmed] Literature search covered 1991-2022, used Web of Science and Google Scholar plus language-specific systems, in 15 languages, to reduce English-language bias · read in full (as of 2026-08-09)
Where we hit a limit / what to double-check
- We did not obtain the full text of Butterflies worldwide are on the move as the climate warms (https://www.eurekalert.org/news-releases/1138655); claims resting on it are from its summary — you may be able to reach it directly.
- We did not obtain the full text of Butterflies on the move worldwide due to climate change (https://www.uwa.edu.au/news/article/2026/august/butterflies-on-the-move-worldwide-due-to-climate-change); claims resting on it are from its summary — you may be able to reach it directly.
- We did not obtain the full text of Insects as bioindicator: A hidden gem for environmental monitoring (https://www.frontiersin.org/journals/environmental-science/articles/10.3389/fenvs.2023.1146052/full); claims resting on it are from its summary — you may be able to reach it directly.
- We did not obtain the full text of Butterfly ranges shift worldwide amid climate change, with most species expanding their reach (https://phys.org/news/2026-08-butterfly-ranges-shift-worldwide-climate.html); claims resting on it are from its summary — you may be able to reach it directly.