
Russia's war economy runs through China, on Beijing's terms
China supplies most of Russia's battlefield technology and buys about a quarter of its oil, but headline shares hinge on how you count — and the leverage flows one way.


What happenedWestern sanctions pushed Russia to reroute trade, leaving China as its dominant source of chips, machine tools and other war-relevant inputs and its largest single oil customer.
Why it mattersThat keeps Russian weapons production going despite export controls while giving Beijing leverage over prices, pipelines and payment channels.
Still openHow large the shares precisely are — estimates span wide bands by method — and whether credible secondary sanctions can durably raise Beijing's cost enough to curb re-exports.
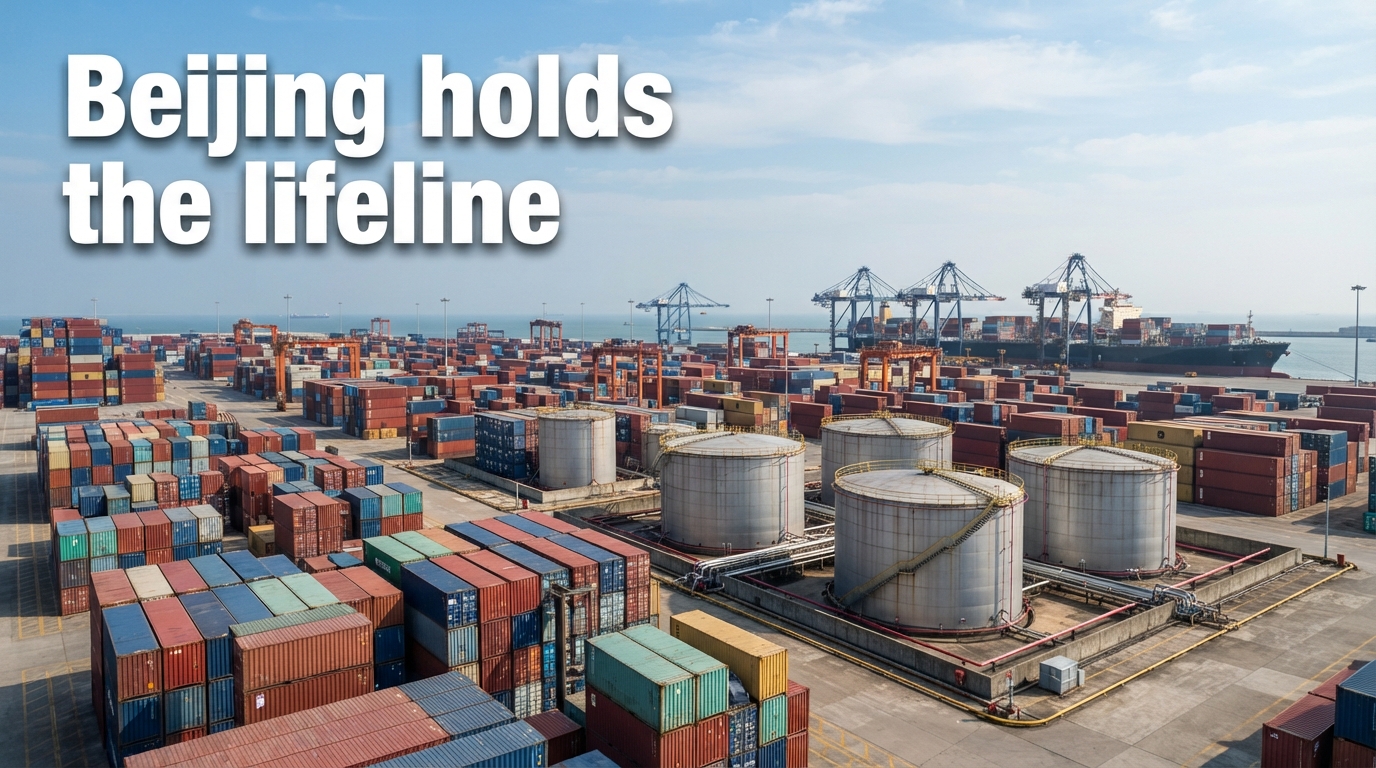
Since Western sanctions hit Russia after its full-scale invasion of Ukraine in 2022, China has become the supplier that keeps Russia's war economy running and the buyer that pays for it — a one-sided dependence that lets Beijing set the price.
How much Russia depends on China versus how much China depends on Russia. Grouped bars show how much of each 2024–25 flow is accounted for by the other country. Russia relies on China for about 87% of dual-use technology imports, 30% of goods exports, and 35–50% of goods imports; China’s matching shares are under 5%, 3%, and 5% — roughly 7–17 times smaller. Oil is the closest dimension: China takes 26% of Russia’s total crude exports (EIA, including pipelines) to 47% of seaborne crude (CREA), while Russia supplied 21.5% of China’s crude imports in 2024. — AI-assisted analytic, built only from real cited or sourced data. Source: Bankier.pl, Centre for Eastern Studies (OSW), MERICS China-Russia Dashboard. As of 2026-05-13.
The turn was forced. The European Union cut exports to Russia by about 60% and the United States and Britain by more than 90%. Russian imports did not collapse; they rerouted. Goods trade between Russia and China more than doubled from 2020 to a peak of $245 billion in 2024, before slipping about 7% in 2025. The shape tells the story: since February 2022 more than 70% of what Russia sends to China has been mineral fuels, while what it buys back is manufactured goods — machinery around 24%, vehicles around 16%, electrical equipment around 15%.
Two numbers dominate the debate — roughly 87% for battlefield technology and roughly 45% for oil — and both need a note on how they are counted, not a decimal point.
The 87% is how NATO and Poland's Centre for Eastern Studies (OSW) describe China's share of Russia's imports of controlled technology. The narrow Western list that matters most on the battlefield points the same way. That list, the Common High Priority List, is a 50-item catalogue of chips, telecom gear, machine tools, optics and navigation equipment jointly controlled by the US, EU, Japan and Britain. Carnegie put China's share at about 90% in 2023, Bloomberg at more than 90% in 2026, and the EU Institute for Security Studies at about 80% of EU dual-use circumvention via China and Hong Kong.
How it gets through is better documented than the headline share. OSW, using Chinese customs data, put Chinese shipments of those 50 priority items at about $1.9 billion in the first half of 2025, down about 7% year-on-year but still dominant as other suppliers collapsed. Within the list, OSW reports sharp rises in surveillance and drone optics, radar and aerial parts, printed circuits and weapon sights.
Beyond the 50 items, OSW finds broader militarization in a handful of inputs: manganese ores for armoured steel rising from 42 tonnes in 2023 to 47,000 tonnes in 2024 and more than 126,000 tonnes in the first half of 2025; turbojet engines above 25 kilonewtons — likely for military aircraft or large drones — up about 37% in six months versus all of 2023-2024 combined; and ballistic fibres for body armour up more than 60%.
A US-China Economic and Security Review Commission analysis finds three main channels for the priority items: direct sales by Chinese firms about 49%, Western-owned factories in China about 16%, and transshipment of foreign-made goods via China and Hong Kong about 18%. The rest, OSW notes, moves via third countries and classification fraud — hiding sensitive goods under residual customs codes, such as drone engines declared as "other spark-ignition engines" ($25m to $105m) and timing apparatus ($1m to $144m). Hong Kong's role as a shell-company hub was underscored when the US Bureau of Industry and Security added entire Hong Kong addresses to its Entity List in June 2024. Much of this is not Chinese-origin technology but Western-designed goods made or routed through China, which is why controls leak even as direct Western exports fall.
Crude oil is the economic glue. In 2024 China bought about 108.5 million tonnes of Russian crude — roughly 2.17 million barrels a day, about one in four Russian barrels and 21.5% of China's own imports. By the first half of 2025 that share slipped to 17.5% as China bought 11% less by volume.
The 45% often cited for oil sits inside a wider band of 26% to 47%. The gap is a different ruler. Trackers that count only seaborne crude put China at 47% of Russia's crude exports; totals that add pipelines — the Eastern Siberia-Pacific Ocean and Druzhba systems carrying roughly 0.6 to 1.0 million barrels a day — put it at 26% in 2024 on US Energy Information Administration data and 32% on Bank of Finland data. The year matters too: 2023 was the peak; in 2024 India overtook China on some totals. The durable picture is a band, with China the largest single buyer but not the sole outlet.
The incentive is price. Between April 2022 and February 2026 China bought Russian crude at an average discount of 7.7%, saving an estimated $18.3 billion, according to OSW. The discount peaked near 18% in 2022, eased to around 5%, and widened again in late 2025 after new US maritime sanctions.
China-Russia goods trade, 2020 to 2025 ($ billion). Annual China–Russia bilateral goods trade, 2020–2025, in current US dollars, as reported by China’s General Administration of Customs (GACC) in its year-end releases 2025: Trade more than doubled after the February 2022 sanctions wave, from $108 billion in 2020 to a $245 billion peak in 2024, then fell 6.9% in 2025 to $228 billion — the first annual decline in five years. Dollar values move with energy prices as well as volumes; Russia’s exports to China are mostly oil, gas, and coal. — AI-assisted analytic, built only from real cited or sourced data. Source: Centre for Eastern Studies (OSW), U.S.-China Economic and Security Review Commission, MERICS China-Russia Dashboard. As of 2026-05-13.
The plumbing has moved off the dollar. More than 90% of bilateral trade was settled in rubles or yuan by early 2024, up from less than 2% in yuan before the war. The yuan share reached near 40% in January 2024, then fell to about 30% after the US threatened secondary sanctions — penalties on third-country banks and firms that deal with Russia even if not American — while the ruble share rose. Physical oil moves largely through a shadow fleet of 400 to 600 tankers to small independent "teapot" refineries in Shandong province. Messaging has shifted toward China's Cross-Border Interbank Payment System and Russia's SPFS financial messaging system. The plumbing is both enabler and vulnerability: in August 2024 Chinese banks paused transactions en masse for about three weeks after the US threat.
Oil and gas still fund about 30% of Russia's federal budget, OSW estimates. When prices and Chinese demand slipped in the first half of 2025, OSW projected Moscow was on track for revenues about 24% below its budget assumption.
The dependence is deeply asymmetric. Estimates from the Bank of Finland and the EU Institute for Security Studies put China's share at about 30% of Russia's exports and 35% to 50% of its imports — 70% to 90% in machinery and vehicles — while Russia accounts for only about 3% of China's exports and 5% of its imports.
That asymmetry is leverage. The proposed Power of Siberia 2 gas pipeline, 50 billion cubic metres a year and negotiated since the late 1990s, remains stalled because Beijing demands Moscow bear the $13bn to $34bn cost and accept prices roughly one-third below Europe; Mongolia has omitted it from its plans. In autos, Moscow raised the recycling fee on imported vehicles by up to 85% in late 2024 — more than $7,000 per standard Chinese car — to force assembly inside Russia. Beijing has not retaliated. In finance, the yuan now makes up about 60% of the liquid assets of Russia's National Wealth Fund, but Chinese banks remain risk-averse to secondary sanctions, giving Washington leverage over Beijing's leverage over Moscow.
A full closure of the Strait of Hormuz — carrying about 20% of global oil — is the stress test analysts use to map, not forecast, what happens next. Models point to a sharp price spike well above the above-$100 Brent at writing. That would imply a windfall for Russia of 6% to 11% of GDP only if its roughly $20-a-barrel sanctions discount disappears as buyers scramble for non-Gulf barrels. The authors flag that as the key uncertainty: if the discount persists, Russian gains are overstated. China, with about 1,200 million barrels of storage — roughly four months of imports — is better buffered than India with about 250 million barrels, about 30 days, but both would lose cheap Iranian barrels and have to bid against each other for the same Russian ones — amplifying, not breaking, the dependence. China was already at a record 1.92 million barrels a day of seaborne Russian imports in February 2026 with floating storage down to 7 million barrels and the Urals discount narrowing from $10 to $5-$6, suggesting limited spare capacity.
Two stories are told about the same trade. Western governments describe China as a decisive enabler: without 80-90%+ of battlefield imports via China and Hong Kong, Russian defence production could not sustain the war in Ukraine. Beijing says it has never provided lethal weapons to any party, maintains the strictest worldwide controls on dual-use items including drones, that China-Russia trade is normal WTO-consistent cooperation not targeted at third parties, opposes unilateral sanctions lacking UN Security Council authorization as double standards, and will defend Chinese firms. It notes most countries, including the US and Europe, have continued to trade with Russia.
Moscow claims technological sovereignty — serial 65-nanometre chip production by 2028 and 70% domestic share by 2030, backed by 210 billion rubles in 2024. Experts note 65nm was mass production globally in 2006-2007 while Taiwan's TSMC now produces at 2nm; Russia's Mikron remains at 180 to 90nm and depends on foreign equipment and 300mm wafers not made in Russia.
On whether pressure works, hawks argue dollar leverage does: US vessel designations cut activity about 80%, and the December 2023 secondary-sanctions threat caused the three-week Chinese bank pause and a measurable dip, with one French CEPII study cited in US commission reporting finding dual-use prices from non-sanctioning countries up about 39%. Skeptics counter that sanctions are reshaped, not collapsed — shadow fleet, yuan settlement, crypto, shell companies and ship-to-ship transfers let traders adapt — while broad secondary sanctions risk retaliation and fragmentation. Brookings notes US enforcement has stalled since January 2025.
The research synthesis is conditional: Beijing calibrates support to cost. Dual-use exports fell after December 2023, rebounded in the second half of 2024, and fell again in early 2025. Targeted secondary sanctions and EU export controls on EU-origin dual-use goods — the EU supplies more than 30% of China's imports in one-third of categories, about $57bn — could force Beijing to prioritize domestic needs over re-exports, but only if credible and sustained.
The lifeline is therefore not an alliance. It is a transactional, cost-calibrated dependence where Moscow needs Beijing far more than Beijing needs Moscow — and where the price is paid in pipeline terms, discounts and payment channels that Beijing controls.
Source recordSources / claims / limits
How this piece is framed: Asymmetric lifeline: How China became the backbone of Russia's war economy — and why that gives Beijing leverage over Moscow
Charts & tables — AI-assisted; provenance on each line
- Russia needs China far more than China needs Russia — from claims clm_14e9e241c1, clm_786ade6332, clm_eedb997376, clm_994182ce99, clm_263c68d5da, clm_f4bc8e0fba · as of 2026-05-13
- China-Russia trade doubled after 2022 sanctions, peaking at $245 billion — sourced for this figure · as of 2026-05-13
Sources
- (primary) China-Russia Dashboard: Facts and figures on a special relationship — MERICS China-Russia Dashboard — https://merics.org/en/china-russia-dashboard-facts-and-figures-special-relationship · read in full · captured 2026-08-15
- (primary) Foreign Ministry Spokesperson Lin Jian's Regular Press Conference on May 8, 2025 — Ministry of Foreign Affairs of the People's Republic of China — https://sl.china-embassy.gov.cn/eng/fyrth/202505/t20250508_11617555.htm · read in full · captured 2026-08-15
- (primary) Foreign Ministry Spokesperson Lin Jian's Regular Press Conference on December 17, 2024 — Ministry of Foreign Affairs of the People's Republic of China — https://www.mfa.gov.cn/eng/xw/fyrbt/202412/t20241218_11501312.html · read in full · captured 2026-08-15
- (secondary) 2028 65 — Kommersant — https://www.kommersant.ru/doc/6800285 · read in full · captured 2026-08-15
- (secondary) Rosja coraz bardziej zależna od Chin. Pekin dostarcza technologie, komponenty i kupuje surowce — Bankier.pl — https://www.bankier.pl/wiadomosc/Rosja-coraz-bardziej-zalezna-od-Chin-Pekin-dostarcza-technologie-komponenty-i-kupuje-surowce-9181005.html · read in full · captured 2026-08-15
- (secondary) State support for microelectronics to total 210 bln rubles in 2024, share of Russian goods should reach 70% by 2030 - Manturov — Interfax — https://www.interfax.com/newsroom/top-stories/95286/ · read in full · captured 2026-08-15
- (secondary) An update on the efficacy of sanctions against Russia — Brookings Institution — https://www.brookings.edu/articles/an-update-on-the-efficacy-of-sanctions-against-russia/ · read in full · captured 2026-08-15
- (secondary) Why does the US use secondary sanctions, and do they work? — Deutsche Welle — https://www.dw.com/en/what-are-us-secondary-sanctions-and-how-do-they-work/a-73599628 · read in full · captured 2026-08-15
- (primary) Russia's ever-increasing economic dependence on China - BOFIT Policy Brief 10/2025 — Bank of Finland Institute for Emerging Economies (BOFIT) — https://publications.bof.fi/handle/10024/54004 · full text not obtained — used its summary
- (primary) Closing ranks: Russia-China energy cooperation amid escalating confrontation with the West — Centre for Eastern Studies (OSW) — https://www.osw.waw.pl/en/publikacje/osw-commentary/2025-12-12/closing-ranks-russia-china-energy-cooperation-amid-escalating · full text not obtained — used its summary
- (primary) Russia's ever-increasing economic dependence on China — Bank of Finland Institute for Emerging Economies (BOFIT) — https://publications.bof.fi/bitstream/handle/10024/54004/bpb2510.pdf · full text not obtained — used its summary
- (primary) Russian Oil Tracker April 2025 — KSE Institute — https://kse.ua/wp-content/uploads/2025/05/ROT_APR25.pdf · full text not obtained — used its summary
- (primary) China's Facilitation of Sanctions and Export Control Evasion — U.S.-China Economic and Security Review Commission — https://www.uscc.gov/sites/default/files/2025-11/Chinas_Facilitation_of_Sanctions_and_Export_Control_Evasion.pdf · full text not obtained — used its summary
- (primary) China-Russia trade in early 2025: Fueling Moscow's war despite headwinds — Centre for Eastern Studies (OSW) — https://www.osw.waw.pl/en/publikacje/analyses/2025-07-30/china-russia-trade-early-2025-fueling-moscows-war-despite-headwinds · full text not obtained — used its summary
- (primary) The Hormuz Blockade: Winners, losers, and vulnerabilities — FREE Network / Swedish Institute of International Affairs — https://freepolicybriefs.org/wp-content/uploads/2026/03/20260320.pdf · full text not obtained — used its summary
- (primary) Country Analysis Brief: Russia — U.S. Energy Information Administration — https://www.eia.gov/international/content/analysis/countries_long/Russia/pdf/Russia%20CAB_2025.pdf · full text not obtained — used its summary
- (secondary) Behind the Scenes: China's Increasing Role in Russia's Defense Industry — Carnegie Endowment for International Peace — https://carnegieendowment.org/russia-eurasia/politika/2024/05/behind-the-scenes-chinas-increasing-role-in-russias-defense-industry · full text not obtained — used its summary
- (secondary) The dependence gap in Russia-China relations — EU Institute for Security Studies — https://www.iss.europa.eu/publications/analysis/dependence-gap-russia-china-relations · full text not obtained — used its summary
- (secondary) How Will the Iran Conflict Impact Oil Prices? — Goldman Sachs — https://www.goldmansachs.com/insights/articles/how-will-the-iran-conflict-impact-oil-prices · full text not obtained — used its summary
Claims, and how far we tracked each down
- [likely] China supplies about 87% of Russia's dual-use goods imports · read in full (as of 2026-08-15)
- [likely] China supplies about 87% of Russia's dual-use goods imports (NATO/OSW characterization; deep-read corroboration shows 80-90%+ for CHPL-50, broader militarization beyond 50 items) · read in full (as of 2026-08-15)
- [contested] China buys about 45% of Russia's crude oil exports on seaborne basis (CREA 47%); on total-exports pipeline-inclusive basis 26% in 2024 (EIA) / 32% (BOFIT/IEA) d band 26-47% depending on methodology · read in full (as of 2026-08-15)
- [confirmed] China is Russia's largest crude oil buyer, importing ~108.5 million tonnes (2.17 million b/d) in 2024, about 21.5% of China's total crude imports; 26% of Russia's total crude exports in 2024 (EIA total basis) · read in full (as of 2026-08-15)
- [confirmed] China-Russia bilateral goods trade reached $245 billion in 2024, roughly double the 2020 level, and fell 6.9% year-on-year in 2025 · read in full (as of 2026-08-15)
- [confirmed] Russia's exports to China are dominated by raw materials: mineral fuels >70% of value since Feb 2022, while China's exports to Russia are manufactured goods (machinery ~24%, vehicles ~16%, electrical equipment ~15%) · read in full (as of 2026-08-15)
- [confirmed] In H1 2025 China exported $1.9 billion of Common High Priority List dual-use items to Russia, down ~7% YoY, but remained Moscow's key supplier as other partners collapsed · from a source summary — we did not read the full source
- [confirmed] Dominant dual-use categories include semiconductors/process units, telecom transmission apparatus, machine tools, optical devices, navigation/radar parts, and bearings; in 2023 machine tools accounted for ~40% of YoY rise · from a source summary — we did not read the full source
- [confirmed] Dominant dual-use categories include semiconductors/process units, telecom transmission apparatus, machine tools, optical devices, navigation/radar parts, and bearings; H1 2025 growth in HS 85299049 x4, 85291010 x5, 853400 x2, 90131000 x4; broader militarization in manganese ores, turbojets >25kN, ballistic fibers, and nes codes 84079090/91069000 · from a source summary — we did not read the full source
- [confirmed] Dual-use goods are routed via direct sales from Chinese firms (49% of CHPL items), Western factories in China (16%), transshipment of non-China-made goods via China/Hong Kong (18%), third-country re-exports, and customs-code fraud/mislabeling · from a source summary — we did not read the full source
- [confirmed] Dual-use goods are routed via direct sales, Western factories in China, transshipment via China/HK, third-country re-exports, and customs-code fraud/mislabeling (including nes categories) · from a source summary — we did not read the full source
- [confirmed] Russia's dependence on China is asymmetric: China accounts for ~30% of Russian exports and ~35-50% of imports in 2024-2025, while Russia accounts for only ~3% of China's exports and ~5% of imports · from a source summary — we did not read the full source
- [confirmed] Russia's dependence on China is asymmetric: China accounts for ~30% of Russian exports and ~35-50% of imports in 2024-2025 (70-90% in machinery/vehicles), while Russia accounts for only ~3% of China's exports and ~5% of imports · read in full (as of 2026-08-15)
- [confirmed] Beijing's leverage over Moscow includes dictating gas pipeline terms (Power of Siberia 2 stalled over price and cost-sharing), imposing recycling fees and certification barriers on Chinese vehicles, and controlling yuan liquidity and payment channels · read in full (as of 2026-08-15)
- [confirmed] China buys Russian crude at a discount averaging 7.7% between April 2022-Feb 2026, saving an estimated $18.3 billion; discount peaked ~18% in 2022, eased to ~5%, rose again late 2025 after new US sanctions · read in full (as of 2026-08-15)
- [confirmed] Over 90% of China-Russia trade was settled in rubles or yuan by early 2024, up from <2% in yuan before the war; yuan share later fell to ~30% after US secondary sanctions threats, with ruble share rising · read in full (as of 2026-08-15)
- [confirmed] Russia's oil and gas revenues provide ~30% of federal budget; falling Chinese demand and lower prices in H1 2025 are projected to push 2025 oil/gas revenues 24% below budget assumptions · from a source summary — we did not read the full source
- [confirmed] Russia's oil and gas revenues provide ~30-31% of federal budget; falling Chinese demand and lower prices in H1 2025 are projected to push 2025 oil/gas revenues 24% below budget assumptions · from a source summary — we did not read the full source
- [likely] A full one-month closure of the Strait of Hormuz would raise Brent to $120/bbl short-term (with 5 mbd inventory draw) and $158/bbl medium-term after inventories deplete, with ~14.2 mbd Gulf seaborne disruption (model-dependent scenario, not forecast) · from a source summary — we did not read the full source
- [likely] Under Hormuz blockade scenarios, Russia would profit substantially (6% short-term to 11% medium-term of GDP) from higher prices and assumed elimination of sanctions discount, while China and India would lose (India 2-4% GDP, China less), and Gulf exporters would lose except Saudi Arabia/UAE via bypass pipelines d model-dependent, key uncertainty is discount disappearance · from a source summary — we did not read the full source
- [likely] A full one-month closure of the Strait of Hormuz would raise Brent by ~$12-15/bbl (Goldman Sachs) or to $120/bbl short-term and $158/bbl medium-term after inventories deplete (FREE model), with ~16 mbd of petroleum flows at risk · from a source summary — we did not read the full source
- [likely] Under Hormuz blockade scenarios, Russia would profit substantially (6-11% of GDP) from higher prices and elimination of sanctions discount, while China and India would lose (India 2-4% GDP, China less), and Gulf exporters would lose except Saudi Arabia/UAE via bypass pipelines · from a source summary — we did not read the full source
- [contested] Beijing officially denies providing lethal weapons to any party in Ukraine and asserts strictest worldwide controls on dual-use items including drones, characterizing China-Russia trade as normal, WTO-consistent, and not targeted at third parties; it opposes unilateral sanctions lacking international law/UNSC authorization as double standards and vows to defend Chinese firms. · read in full (as of 2026-08-15)
- [contested] Beijing's counter-narrative on attribution: MFA argues most countries including US/EU continue trading with Russia and that accusations against normal China-Russia exchanges are blame-shifting/political manipulation. · read in full (as of 2026-08-15)
- [contested] Moscow's official import-substitution narrative claims technological sovereignty is achievable: government plan mandates Mikron serial 65nm production by 2028 and 70% domestic share of equipment/materials and finished microelectronics by 2030, backed by 210bn RUB state support in 2024 (vs <10bn in 2020), with domestic lithographs 350nm (2024) 130nm prototype (2026). · read in full (as of 2026-08-15)
- [likely] Moscow's 65nm/70% targets face credible expert qualification: 65nm was mass-produced globally in 2006-2007 while TSMC now at 2nm; Mikron currently limited to 180-90nm for transport cards/IoT; achieving 65nm requires foreign equipment and 300mm wafers not produced in Russia; STMicroelectronics transfer failed in 2014 due to sanctions. · read in full (as of 2026-08-15)
- [contested] Western sanctions-effectiveness debate is split: hawks argue secondary sanctions leverage dollar/financial system and have measurable bite (US vessel designations ~80% activity drop; Dec 2023 US secondary-sanctions threat caused Chinese banks to pause transactions and raised Russian costs), while skeptics argue sanctions are leaky, easily evaded via shadow fleet (1,400 tankers), yuan/crypto/barter, shell companies, and risk retaliation and fragmentation many researchers view secondary sanctions as having all the worst attributes plus instigating new conflicts with allies/adversaries and should be used only in narrow circumstances. · read in full (as of 2026-08-15)
- [likely] Secondary sanctions are not a silver bullet and their credibility is decisive: DW cites Harned like all threats, it loses its power if it is not perceived as credible or other loopholes are found and Forrer if deployed incorrectly, they can do more harm than good; Brookings shows effectiveness depends on US participation, which has stalled since January 2025, limiting coalition pressure. · read in full (as of 2026-08-15)
- [contested] Assessment of China as decisive enabler varies across institutions: USCC/Ribakova and NATO frame China as indispensable lifeline (90% of CHPL via China/HK), EUISS/MERICS note Beijing calibrates support to economic cost (exports fell after Dec 2023 threat, rebounded H2 2024), implying leverage exists, while Carnegie/CFR and sanctions-skeptic literature emphasize limits, opportunism, and that China remains wary of jeopardizing access to Western markets suggesting secondary sanctions have deterrent effect but also overreach risks. · read in full (as of 2026-08-15)
- [confirmed] China's dual-use exports are sensitive to secondary sanctions: they fell sharply after Dec 2023 US threat, rebounded H2 2024, and fell again early 2025, showing Beijing calibrates support to economic cost · read in full (as of 2026-08-15)
Where we hit a limit / what to double-check
- We did not obtain the full text of Russia's ever-increasing economic dependence on China - BOFIT Policy Brief 10/2025 (https://publications.bof.fi/handle/10024/54004); claims resting on it are from its summary — you may be able to reach it directly.
- We did not obtain the full text of Closing ranks: Russia-China energy cooperation amid escalating confrontation with the West (https://www.osw.waw.pl/en/publikacje/osw-commentary/2025-12-12/closing-ranks-russia-china-energy-cooperation-amid-escalating); claims resting on it are from its summary — you may be able to reach it directly.
- We did not obtain the full text of Behind the Scenes: China's Increasing Role in Russia's Defense Industry (https://carnegieendowment.org/russia-eurasia/politika/2024/05/behind-the-scenes-chinas-increasing-role-in-russias-defense-industry); claims resting on it are from its summary — you may be able to reach it directly.
- We did not obtain the full text of The dependence gap in Russia-China relations (https://www.iss.europa.eu/publications/analysis/dependence-gap-russia-china-relations); claims resting on it are from its summary — you may be able to reach it directly.
- We did not obtain the full text of Russia's ever-increasing economic dependence on China (https://publications.bof.fi/bitstream/handle/10024/54004/bpb2510.pdf); claims resting on it are from its summary — you may be able to reach it directly.
- We did not obtain the full text of Russian Oil Tracker April 2025 (https://kse.ua/wp-content/uploads/2025/05/ROT_APR25.pdf); claims resting on it are from its summary — you may be able to reach it directly.
- We did not obtain the full text of China's Facilitation of Sanctions and Export Control Evasion (https://www.uscc.gov/sites/default/files/2025-11/Chinas_Facilitation_of_Sanctions_and_Export_Control_Evasion.pdf); claims resting on it are from its summary — you may be able to reach it directly.
- We did not obtain the full text of China-Russia trade in early 2025: Fueling Moscow's war despite headwinds (https://www.osw.waw.pl/en/publikacje/analyses/2025-07-30/china-russia-trade-early-2025-fueling-moscows-war-despite-headwinds); claims resting on it are from its summary — you may be able to reach it directly.
- We did not obtain the full text of The Hormuz Blockade: Winners, losers, and vulnerabilities (https://freepolicybriefs.org/wp-content/uploads/2026/03/20260320.pdf); claims resting on it are from its summary — you may be able to reach it directly.
- We did not obtain the full text of How Will the Iran Conflict Impact Oil Prices? (https://www.goldmansachs.com/insights/articles/how-will-the-iran-conflict-impact-oil-prices); claims resting on it are from its summary — you may be able to reach it directly.
- We did not obtain the full text of Country Analysis Brief: Russia (https://www.eia.gov/international/content/analysis/countries_long/Russia/pdf/Russia%20CAB_2025.pdf); claims resting on it are from its summary — you may be able to reach it directly.
- Figures we could not match to our stored evidence — worth confirming against the source (which may state them exactly), and note live sources move: 60%, 37%, 17.5%, 35%, 85%, 20%, 39%.